
The king of the hill has returned for Weymouth! In his first spell he became the first Terras manager to break a host of records last set in 1949 – consecutive promotions, consecutive seasons scoring 100+ league & cup goals, most points ever over consecutive season.
He ranks 4th in the all-time manager list for the club in terms of win percentages with 57.7%.
He helped to create a perfect storm of success…but…can lightning strike twice and if so…how can he do it?
Part season review, part managerial guide for the forthcoming campaign, I will analyse 7 key metrics for the season just gone and see where Molesley needs to match or better those indicators and what “success” would look like this time around…
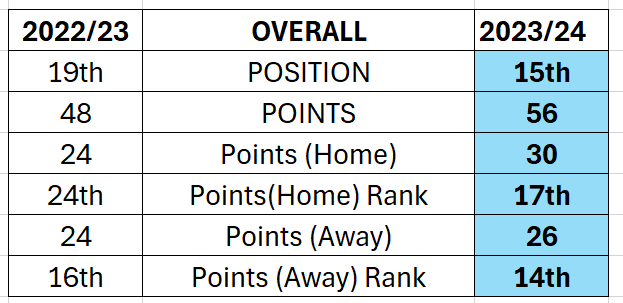
1. – POSITION…The simplest metric of them all!
Last season we finished 15th – an improvement of a whopping 4 places from the previous campaign. (However, we would have been 16th had it not been for Torquay’s 11 point deduction!)

This coming season marks uncharted waters for the club – the first time we will have spent three consecutive seasons in the National League South so what happened the previous times we were in this division…
Previous spells in the National league south –
2004-06 – PROMOTED from Southern league…finished 7th…then 1st…PROMOTED to National League
2009-10 – RELEGATED from National league…finished 22nd…RELEGATED to Southern League
2019-20 – PROMOTED from Southern league…finished 3rd…PROMOTED to National League
WHAT DOES SUCCESS LOOK LIKE? – Molesley’s mantra is all about “continual improvement” and he will only consider a higher place finish as a success but…in a tough league on a relatively small budget how far can he go?…Let’s aim for 12th place…
2. – POINTS…win prizes!
56 points last season was an 8 point increase on the previous campaign but if we want to gain that 12th spot (and top half of the table finish) we will quite possibly have to make the same improvement again…as the 12th placed team garnering 62 & 66 points in the last two seasons.
At home we gained 30pts at 1.3Points per game(PPG) and away 26pts at 1.1PPG. Looking at the table below its clear we most need to improve our home tally with only a rank of 17th in the division last season.
Famously we have struggled in recent seasons under the lights at home…In 5 Tuesday evening home league games games in the last campaign we only won once with a P5 W1 D2 L2 record for a paltry return of 5 points at just 1.00PPG (win v Truro). Four of these games were in November or February so smaller and less vociferous crowds is a factor that somehow needs to be combated.
Away from home we appeared to have similar problems on Tuesday evenings in the last campaign but three points from one win over four games played (v Taunton) is a small sample.
WHAT DOES SUCCESS LOOK LIKE? – Well if we want to aim for that 12th place then we have the answer above based on what teams have done in the last two campaigns…62-66 points…
3. – GOALS SCORED…you can’ win games without them!
17th in this metric last season so below our league placing and definitely an area for improvement. We only scored 58 goals, one FEWER than 2022/23 when we only secured safety from relegation on the final day of the season!
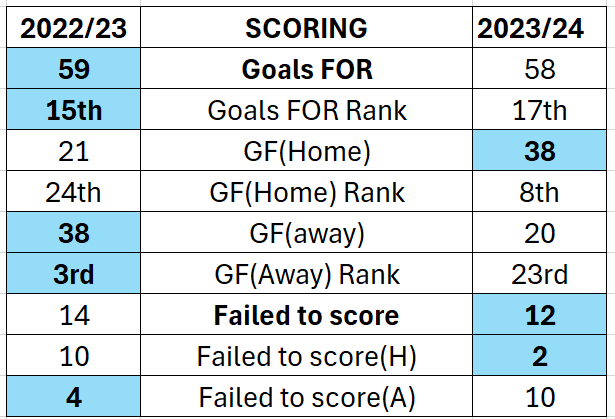
We did at least score in more games – 34 compared to 32 but we scored more than once just 14 times, we bettered that by 3 in the previous campaign.
Home comforts were almost doubled though with 38 strikes rustling the onion bag with just 21 the season before! We failed to score just twice at the Bob Lucas (against playoff teams Braintree & Chelmsford). In 2022/23 we failed to find the net 10/23 times!
Away from home the picture is almost exactly reversed. We scored just 20 times in 23 games compared to 38 in 2022/23. We failed to score 10 times compared to just 4 times the season before.
WHAT DOES SUCCESS LOOK LIKE? – It has to be to match what we scored at home and to score more away to help the climb up to mid-table…70 goals scored…40 at home and 30 away…
(We have a wealth of option up front now with Amartey, Goodship, Linton, Pollock & Touray so we should not have an issue with rustling the onion bag more often this term…)
4. – GOALS AGAINST…Another interesting home/away split here!
Overall this was superb for where we want to be – 64 conceded, 14 less than the season before and 9th place in this metric compared to 22nd in 2022/23! However, the home/away split is very striking.
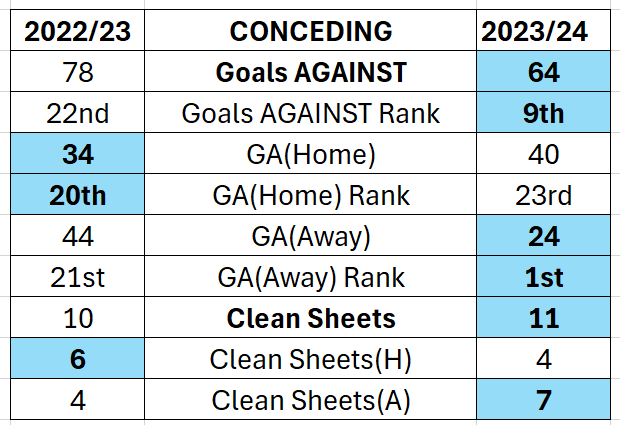
At the Bob Lucas we let in 40 goals but conceded just the 24 away. This resulted in us being ranked as having the joint best away defence in the division…and yet the second worst at home!
7 clean sheets on the road was the joint most in 20 seasons – matching the 2015/16 tally!
WHAT DOES SUCCESS LOOK LIKE? – Maintaining our fantastic defending away from home would be an asset many fans I am sure would like to keep but will that be possible with a more attack-minded team? Jury is out on this one…
5. – GOALS TOTAL…Not truly a metric but bear with dear reader…
Because of our extraordinary home/away split in scoring & conceding last season, this needs to be looked at and tracked as we enter 2024/25. It will be a key way to understand any difference in Molesley’s playing style in how to achieve points at the Bob Lucas and on the road…
Average goals “scored-against”…
23/24 – HOME – 1.65-1.74 (3.39 total goals per game)
23/24 – AWAY – 0.87-1.04 (1.91 total goals per game)
The difference above is extraordinary and both were outliers in the 3pts per win era as shown in the charts below…
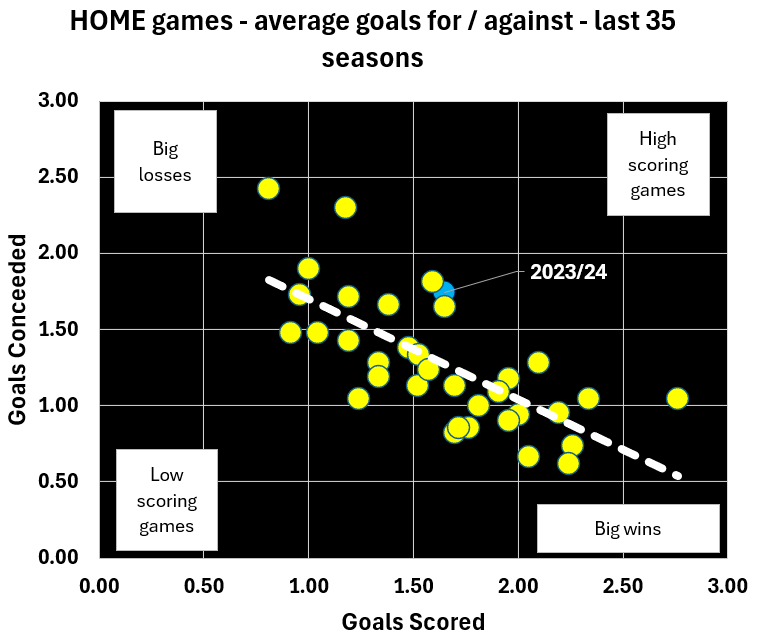
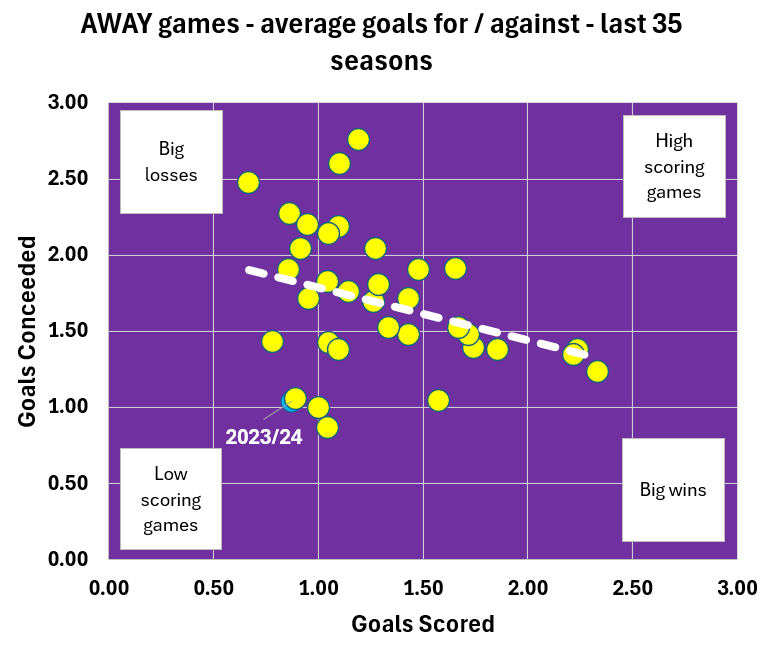
WHAT DOES SUCCESS LOOK LIKE? – A positive goal difference at home is a must for any team aspiring to firmly pull away from the bottom third of the table but apart from that, how Molesley chooses to attack and defend at home and away will be fascinating and “success” could be achieved from a variety of more or less expansive tactics.
For example, he might be happy to continue with the exciting high scoring home games to get “bums on seats” and improve our aforementioned poor “Tuesday nights under the lights” record at the Bob Lucas…but he will be desperate to nudge that home GD from a minus to a positive to have an affect on the bottom line of home points on the board.
5. – TIME OF FIRST & SECOND GOAL…Scoring early to control the game
It’s pretty obvious that scoring first is key in most games as it means you can dictate the play and hope to control the match.
Conference South – Weymouth WDL record – last two seasons
Scoring FIRST – P36 W22 D7 L7 PPG-2.03
Scoring SECOND – P48 W5 D8 L35 PPG-0.48
And scoring first is something we did well in the first half of last season but as you can see from the chart below that dropped off badly from January onwards and a trend that Molesley will be keen to reverse.
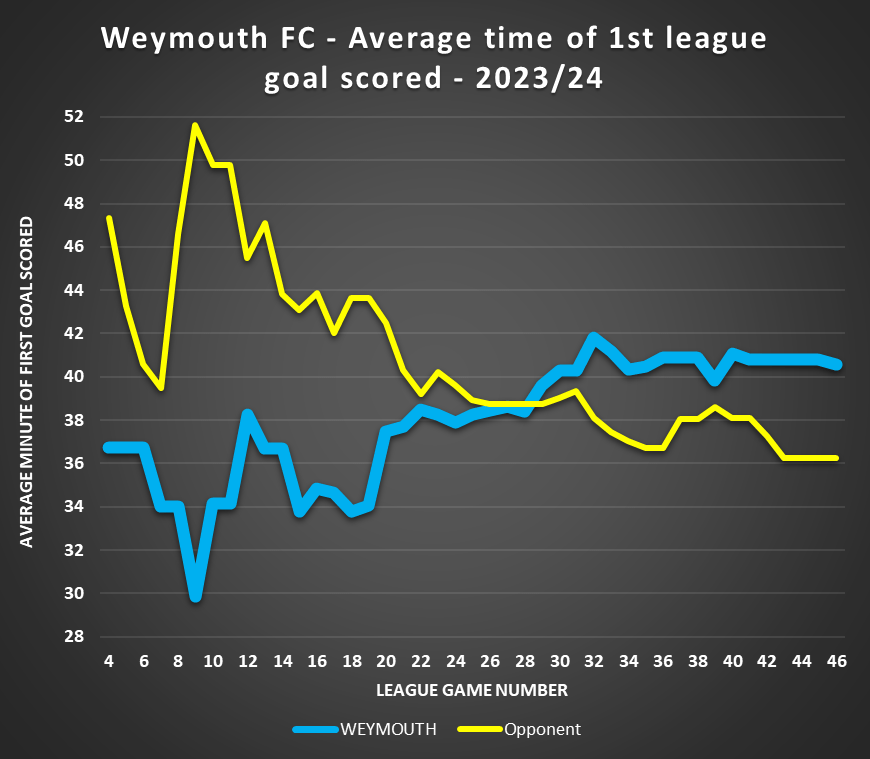
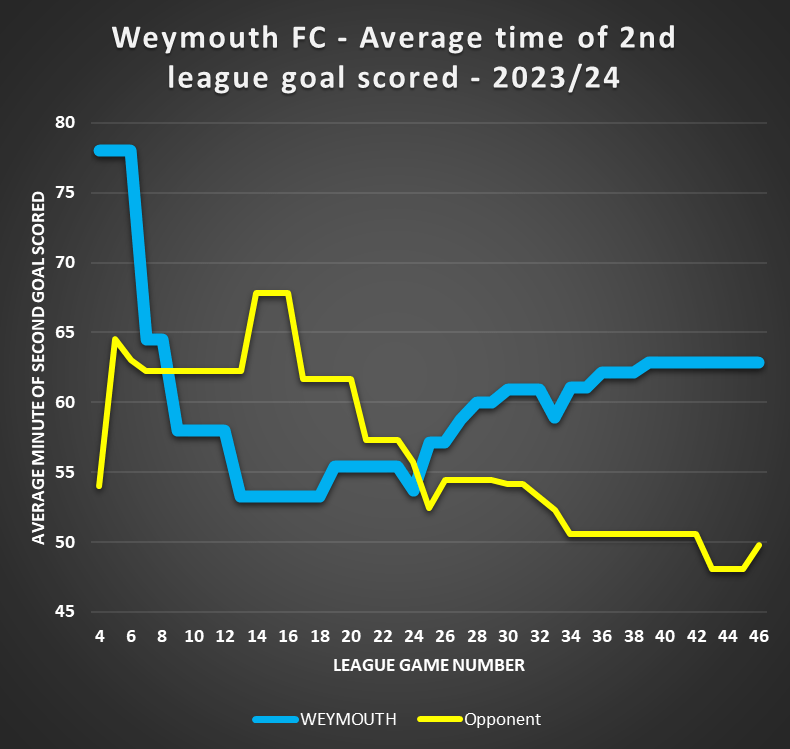
The trend is very similar for the second goal in each game too with our opponents scoring their second goal before us by game 25 of the last campaign…
Another linked metric is half time position. From matchday 29 onwards we we led at the break just twice over our final 18 games. Over that period the H/T position was W2 D9 L7 which translated to W5 D6 L7 at the final whistle so we did at least do better in the second half, “gaining” 6 points over that period but is it a sustainable strategy always fighting to recover losing positions?
Probably not…When we scored first last season AND before half time, our full-time record record was P17 W9 D6 L2 (1.94PPG). When our opponents did the same their record was P20 W11 D7 L2(2.00PPG). Therefore when our opposition scored first and did so before the break, they eventually gained slightly more points. Whether it’s enough of a difference to be statistically significant though is one to ponder….
Some people always cling to the adage that you can “score too early” but the stats don’t really show that – in the last two seasons we have opened the scoring 10 times in the first 15 mins for a P10 W6 D2 L2 record for a 2.00PPG, almost identical to scoring first at any time.
Our opponents scored first 17 times in the first 15 minutes and, in those games, we managed a W3 D2 L12 record for 0.65PPG. Interestingly this suggests we are better than our opponents at turning over early deficits but statistically its still a much better plan to score first!
WHAT DOES SUCCESS LOOK LIKE? – Pretty simple really isn’t it…scoring earlier than the opposition for the first and second goal. Hopefully we can recreate the formula that enabled us to do that in the first half of last season and not the second…
6. LOANEES…Use of the loan market

Obviously with Molesley’s return, his use of the loan market with be scrutinised. And of course most especially any AFC Bournemouth players as, although he no longer is employed by the club, one would imagine his long relationship with the Cherries will mean we can have the pick of some young loan starlets.
Like it or not, loans are now key for teams in non league. Last season 16% of all league minutes on the pitch by Terras players were by loanees (an average of almost 2 players on the pitch at any one time) and they punched above their weight in terms of goals scored with 11, that’s 19% of the tally when less than 15% of the outfield minutes were by loan players. Intriguingly though we never took on any midfield loanees last season!

When Molesley was last in charge at Weymouth he also heavily used the loan market, making use of his dual role at the time with the AFC Bournemouth academy especially in the conference south promotion season in 2019/20. That season the percentage of time on the pitch by AFCB loanees ALONE was more than the total from all clubs in 2023/24!
AFC Bournemouth loanees used by Molesley at Weymouth
(% of league mins played by AFCB loanees)
2019/20 – CONF STH – 18.6%
2018/19 – STH PREM – 5.6%
2017/18 – STH PREM – 7.7%
WHAT DOES SUCCESS LOOK LIKE? – Not an easy question to answer. In a negative sense, relying on loanees to plug gaps can adversely affect team cohesion, upsetting the apple cart with players who are replaced in the starting line up at short notice. It’s also a gamble that doesn’t always pay off – players may go out on loan due to poor form or are injury prone.
However, there can of course be many benefits – players can come in from their parent club, often a division or two higher as a better standard of player. They can lift the whole squad, performing well with a point to prove to their employers and can often be cheaper than paying a contracted player (depending on the deal).
And…lo and behold…Molesely has already started – bringing in goalkeeper Billy Terrell on a season-long loan from…you’ve guessed it…AFC Bournemouth…
7. RECORD AGAINST EACH POSITION…How did we do against the high-flyers and in the “six-pointers”.
Important as if we are to climb the table we obviously need to start taking more points off the teams above us but how did we do last season?
v 1st-7th – Title winners & playoffs (9pts from 14games 0.64PPG)
Home – 4pts from 7gms(Just the one famous “win” over champions Ye0vil & a draw against Aveley in 7th
Away – 5pts from 7gms(nothing against the top 4, drew at 5th placed Braintree & 6th placed Bath, won at Aveley)
v 8th – 12th – The rest of the top half (8pts from 10 games 0.80PPG)
Home – 5pts from 5gms(A win over Slough(10th) and draws over St.Albans(11th) & Chippenham(12th)
Away – 3pts from 5gms(Three draws over Farnborough(8th), Slough & Chippenham)
13th-20th – The bottom half teams that stayed up (21pts from 14 games 1.50PPG)
Home – 13pts from 7gms(Unbeaten! 3 wins over Truro(16th), Eastbourne(19th) & Hemel(20th) with 4 draws against the rest.
Away – 8pts from 7gms(Not so good. Two wins over Weston(13th) & Hemel with a pair of draws at Truro & Welling(17th)
21st – 24th – The relegated teams (18pts from 8 games 2.25PPG)
Home – 8pts from 4 gms (Two wins but Taunton (22nd) & Dover (24th) both left the Bob Lucas with a point each)
Away – 10pts from 4 gms (Almost perfect! Three wins and just the one draw against Havant (23rd).
WHAT DOES SUCCESS LOOK LIKE?
Firstly maintaining an unbeaten record against those in the bottom four would be key to ensure we aren’t one of them! It will be expected again but not a given!
Overall it’s fascinating that that points gained increase as you go down the table in these groupings. Sounds obvious but honestly doesn’t always happen this neatly. Looking at the detail though obviously gaining more points on the road against those teams 13th to 20th would help us to progress – only 8pts from those 7 games was a poor return.
Similarly only winning 1 in 10 against the top half teams outside the playoffs stifled our chances of finishing higher and even a couple of victories here would help the cause.
CONCLUSION
Every fan and every manager will seek “improvement” from the previous season but how you define that will be key.
The whole club needs to be realistic on what that improvement could look like and that it could well be minimal in this extremely competitive league with around five full time teams (and others probably in a blended model) where their players are able to train more often.
“On the field” we finished 16th last season with 56 points so it is about aiming for that tally first and seeking those “marginal gains” as just a couple more wins could see us creep into the top half of the table.
How Molesley goes about that will be fascinating. Last season saw high scoring games at home (that were not always in our favour!) but we kept it really tight away. Will he maintain that style or be more defensive at home and more attacking away?
There are many ways he can achieve a incremental success but with such a wealth of attacking promise and his previous history at the club you have to wonder if the focus will be on the “Goals For” column this season…


Leave a comment