
LLLLLL
There is no way to sugar-coat it. This has been the worst start to a league campaign EVER for Weymouth FC with SIX losses on the bounce.
We were “expected” to have 7 points after 6 games based on our position at the end of last season. (Calculated from bookies odds and prediction websites such as nonleagueranking.com)
But with 0 points we are already 1 point behind where we were after 6 games of the “great escape” season in 2022/23!
But have we been “unlucky” and is there hope for a turnaround?
The club certainly thought so after matchday 5, posting the following on social media comparing the following stats against counterparts in conference south and north. (Including the north division is a bit pointless in my opinion as we don’t play those teams but we will ignore that).
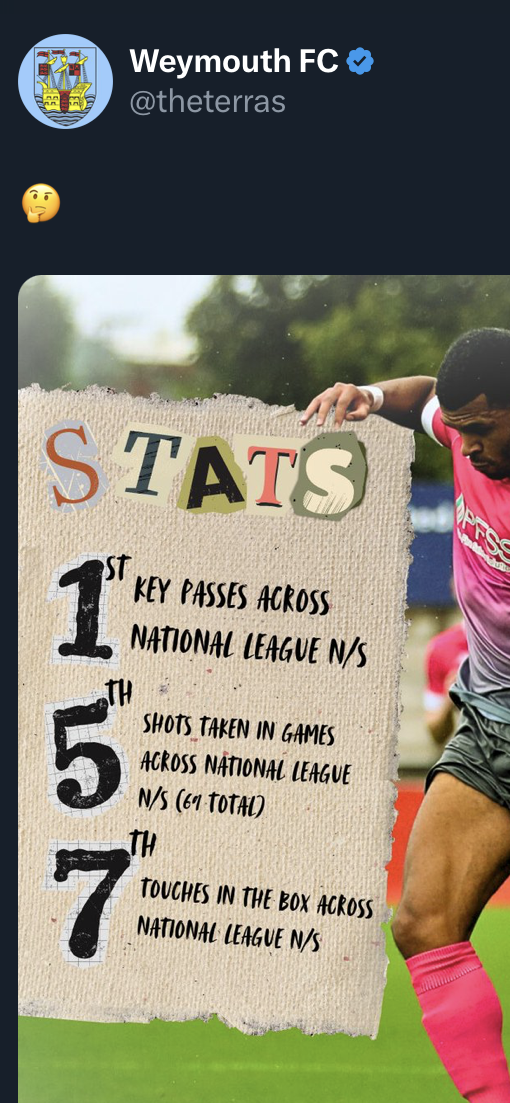
So what do these stats mean?
“1st in key passes across national league N/S” – No other club has created as many goal scoring chances basically. Ok so that’s great – we are creating chances – something every team looks to do…
“5th – shots taken across national league N/S” – We are ranked 5th across the 48 clubs at our level in terms of shots taken. Chances taken! Even better then!
“7th – touches in the box across national league N/S” – Playing high up the pitch – naturally linked to the above to stats so all promising!…
So…if everything is so rosy…why are we rock bottom of the table and only scored TWICE in those 6 games?!
Well lets start with a little fact check first of all. The club state that we had 69 shots after 5 games and, based on the Sofascore app that uses the infamous Wyscout data that was correct. After game 6 we moved up to 74 shots.
But…crucially…how many of those have been on target? The truth is just 13 of the 74. That’s 17.6% or around 1 in 6. Even comparing that to other teams around us shows we are already lacking in that department…
| Position at Sun 1st Sep – Team | Shots |
| 21 – Enfield | 20 on target (from 62 shots) |
| 22 – Aveley | 18 on target (from 65 shots) |
| 23 – St Albans | 14 on target (from 49 shots) |
| 24 – Weymouth | 13 on target (from 74 shots) |
If we just look at the Weymouth games so far it also looks good initially until you drill down a little more.
Overall we have had more shots than our opponents (74 v 68) and out-shot them 3 out of 6 times…not bad…until you look at shots on target…when we only fired more towards goal in the curtain raiser against Tonbridge (6 v 4).
Since that opening close game we have only registered 5 shots on target in the following 5 games – troubling the keeper on average once every 90 minutes over that period! Or…looking at it another way…we registered 6 shots on target in game 1 and 7 shots in the next 5 games COMBINED!
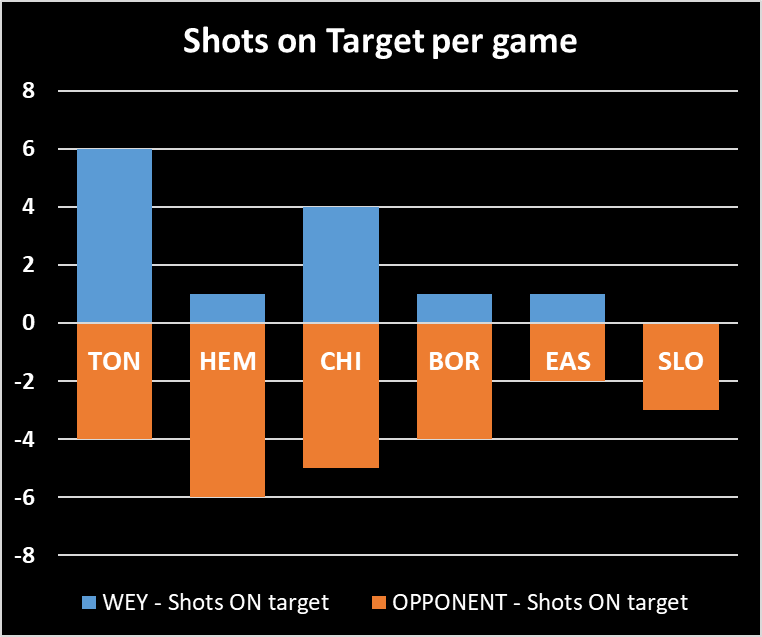
The percentage of our shots on target has also dropped game on game (apart from a slight rise for game 3 against Chippenham).
And…crucially…in every single game we have played so far…our opponent has been more accurate with their shots than us.

Conversation rates are obviously equally concerning. With just two goals scored from 74 shots overall, our conversion rate is 2.7%, one goal for every 37 shots!
Our current drop zone rivals (at Sept 1st!) all fair better in that department too –
Aveley 6.2%, St. Albans 8.2%, Enfield 9.7%.
Player power…
One of the great things we can see from the new sofascore app is individual player data and from that we can clearly see who is contributing to the overall stats.
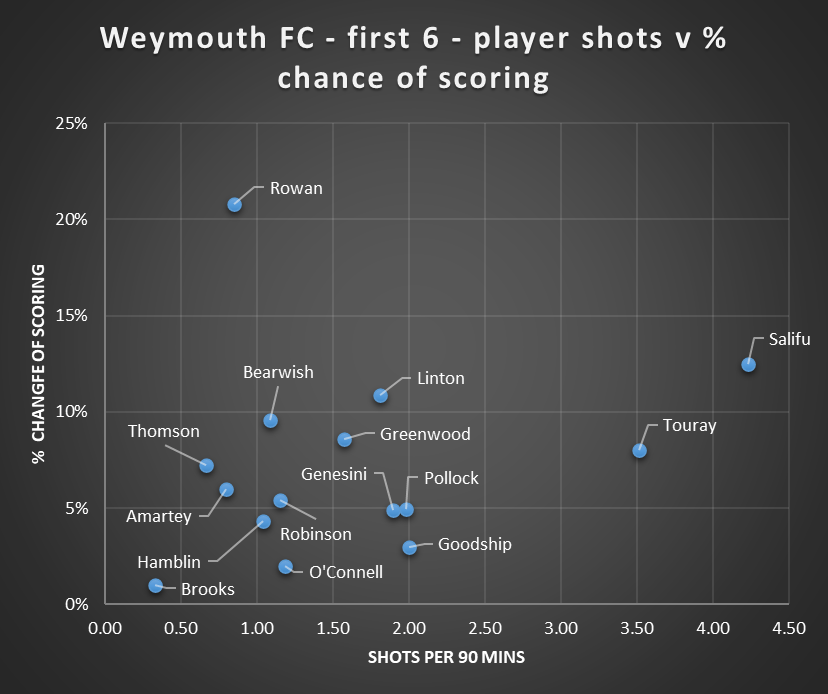
Below I have chosen to show average shots per 90 mins along the bottom with average “worth of shot” up the side. (WARNING…This does use xG “expected goals” data which has its faults, I am first to admit that, but over time it can show how good on average shots are by each attacker).
For example, it suggests currently that Rowan is our best marksman as, on average, each of his shots had a 21% chance of going in. However, he only averages 0.85 shots over 90 mins so does not shoot regularly. Conversely it shows that Salifu shoots most often with 4.24 in 90 mins (although this was 4 shots in 85 minutes overall and from just one game, a small sample).
Crucially none of our players are currently firing off a lot of shots AND frequently – we need players to move up into the top right quadrant to ultimately improve our goal tally.
If we believe the xG data, it suggests with the chances we have had so far we should have scored SIX goals and not TWO. Therefore we are underperforming in that metric. The good news is that if we continue to create chances the model suggests our “luck” should even out over time…
However…what about the defence?
Again using xG data, the stats suggest we should only have conceded EIGHT goals to date instead of TWELVE and there is something striking in the data about the chances we have let in…SIX of the TWELVE goals conceded to date have been rated at having a 10% or less chance of being scored…a further TWO were 11-20% chances!
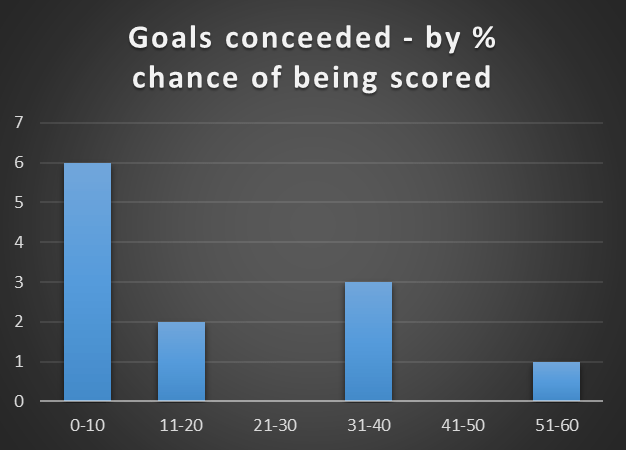
Whether the above shows we have been on the wrong side of a few “worldies” or whether bad defending was to blame is open to debate!
CONCLUSION
The statistics after 6 games are clear.
Based on xG data it was expected we would have 7 points at this stage not 0, based on the chances for ourselves and for our opponents in games.
However, 6 games is a small sample size and this could go one of two ways…our “luck” evens out and we amass more points than “expected” over the remainder of the season…or…the model changes based on “new data” and our expected level drops to match a new reality.
Arrigo Sacchi always said that there is no such thing as luck – it is merely the moment talent meets opportunity…but do we have the talent to take advantage of the opportunities that are available to us and able to deny opponents theirs?
If not are we able to use the loan market effectively to turn our season around?
Time will tell but how much time do we have?…

Leave a comment