

According to the good people at www.nonleagueranking.com we had only a 13% chance of beating Dorking in their own back yard. So how did we do it?
Pedants would say because we scored more goals than them but…what did we do differently to win when we failed in the 7 previous chances this season?!
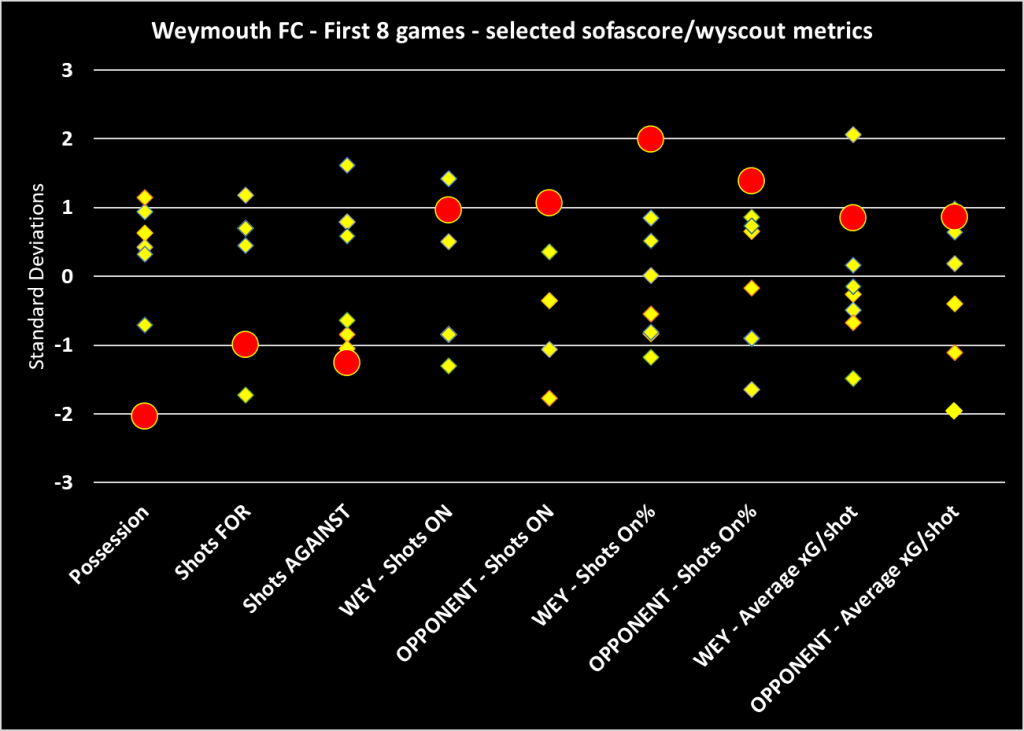
We can answer this because this season we have the benefit of a new data source with the sofascore app that uses the famous wyscout data. Yes the data is not perfect but it does provide some hints if we look at the chart below that I will explain…
Legend –
Red circles – Dorking game
Yellow diamonds – other 7 league games
The vertical spread is shown by standard deviations from the mean so that each metric can be judged in the same way.
High = good for Weymouth in all cases (e.g. If “Opponent Shots ON” is few that metric will be ranked high as its a desired outcome)
Possession – Well this wasn’t the reason! We “enjoyed” just 23% of the ball in Surrey, by far our worst ratio of the season to date.
Shots FOR – Again, not great. Just 8 shots in the game, we were only more shot shy against Slough with 5.
Shots AGAINST – Dorking peppered our goal! 18 shots, the most we have faced all campaign.
Wey shots ON – Now we are onto something…5 on target, we only managed more against Tonbridge on the opening weekend.
Wey shot ON% – Off the charts! You could have probably worked this one out for yourselves but 63% on target was by far our best return. We have averaged just 24% over the first 8 games.
Opponent shots ON% – Very poor! Ah…a story emerges! Just 2 of Dorking’s 18 shots required saving…very wasteful!
Wey – Average xG/shot – Ok I am in danger of losing people here as I mention xG but it can show the average value of our shots and against Dorking we again did well – on the main these were not speculative efforts with little chance of success but strikes closer to goal – each had a 10% chance of rustling the onion bag – we only bettered this in one game to date – 13% v Chippenham
Opponent – Average xG/shot – Again poor for Dorking – Only Hampton & Richmond managed a worse average value for each shot at 6.9% chance of scoring compared to Dorking’s 7.4%. (Hampton’s data point is behind Dorking’s circle on the chart).
CONCLUSION – So how did we win the game?
Basically despite having few shots they were generally accurate and from goal scoring areas.
Conversely – although Dorking enjoyed more than shots against us than anyone else so far this season they were often speculative.
In layman’s terms…we took our chances whereas Dorking did not with theirs.
“Luck” some might say although a statistician would call this game an “outlier”. In other words if you simulated this game over and over based on the chances each team had a Weymouth win would never be the most likely outcome, not by a long stretch.
Yes this result “evens out” some of the outlier data from our first 7 games but to climb the table more this season we need to continue to increase the valuable chances we create and make more from them as shot creation itself has not been the issue – we have had more shots than our opponent 4 times out of 8 so far and probably should have gained 9 points based on this, not just 3…

Leave a comment