Hurrah! Player ratings have finally made it to the Conference South courtesy of Sofascore! (No I am not being sponsored by them for this post!)
So how does it score Weymouth FC players now we are 10 games into the season?…And what does other sofaascore data say more generally about our expected team performances so far?…
Player ratings out of 10 have been available for years but this is the first time i’ve seen it being available at this level!
However…Sofascore ratings have to be taken with a large pinch of salt. They say themselves they are “biased” towards actions that contribute to scoring or conceding goals and that they calculate scores based on certain factors…
Positive – Contributing to goals, making tackles, key passes, dribbles, interceptions,
Negative – Own goal, penalty conceded, red card, a sum of errors.
They also state that this may result in, for example, a player who nets two goals being rated lower than another making more tackles and not scoring any goals.
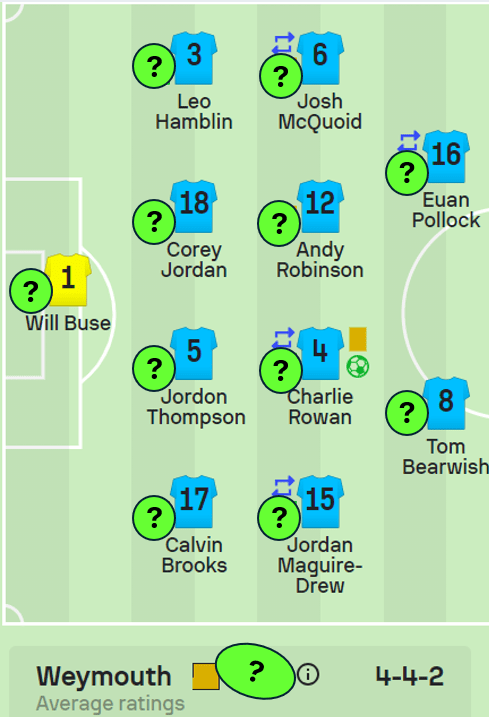
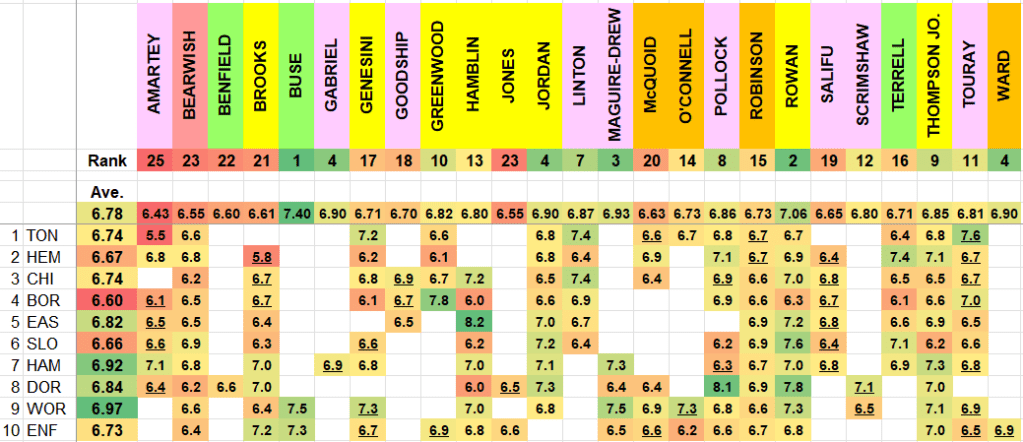
But…with the caveats out of the way…how have Weymouth players rated so far in league games…(You might need to zoom in on this one)
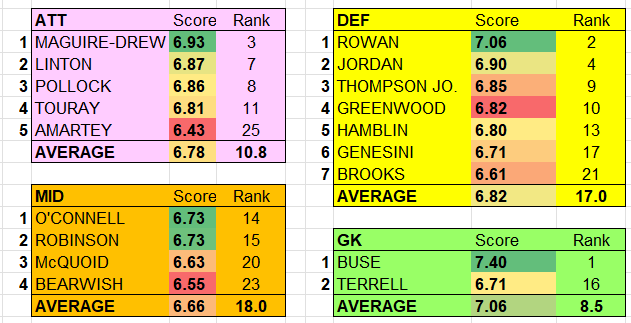
ATTACK
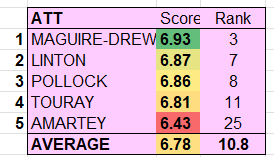
On the face of it not much to choose between the first four players with Maguire-Drew apparently the pick of the pack. This could be because that in 6 league games he has already bagged 4 pre-assists(the pass before the assist). I don’t know if that is used in sofascore ratings but it would certainly fit.
Remember Touray‘s rating here when we look at other data later and perhaps Molesley’s decision to let Amartey go was justified. He has the lowest rank of all 25 players used so far this season.
(Gabriel, Goodship & Scrimshaw excluded due to playing less than 180mins)
MIDFIELD

You can’t put a cigarette paper between O’Connell & Robinson here but their equal averages hide an interesting difference – the latter has shown ridiculous consistency – always scoring 6.6 to 6.9. What that means is open to question but as a starting value for any player is 6.5 it could point to the fact that the sum of his contributions are always positive but perhaps not numerous!
(Ward excluded due to playing less than 180mins)
DEFENCE
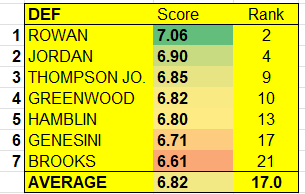
I think if I was Brooks looking at this I would feel somewhat aggrieved! Perhaps he has been on the wrong side of too many last ditch tackles as to rank 24th of 25 players when he has scored a goal seems very harsh!
On the flip side it is quite possible other defenders have benefitted from playing more of their football in the centre and therefore been less exposed?
(Jones excluded due to playing less than 180mins)
GOALKEEPERS
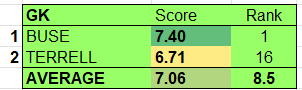
Buse is the highest ranked player overall but with only two games under his belt between the sticks this is probably one to park for now until he (or indeed others) have more games to compare with Terrell. Buse will have no doubt benefitted from one of his two league games to date being against Worthing when he made a number of notable saves.
(Benfield excluded due to playing less than 180mins)
And…the overall averages by position…more than 150 mins played
Attackers & xG data
Yes…sorry!!! I am going to start looking at xG again! I am sceptical of it myself but I do think that over a few games it can even out to something that might tell a story and we certainly are starting to see one with Weymouth and, most specifically, our attacking players.
The graphic below shows the average number of shots per 90 mins on the X axis and the % chance of scoring from each shot on average on the Y axis. (In other words the Y axis shows the average “worthiness” of each shot).
“Good” in the chart below = the top right quadrant – In simple terms anyone here is having lots of shots from areas that more often produce goals and here we find Touray out on his own. Evidence many will cry for him starting more often but can he replicate his form as a sub when starting from minute 1? Not in the league so far this season – in 163 minutes from starting he managed just 4 shots at an average of 2.2 per 90 mins and only a 3% chance of each of these shots rustling the onion bag – much lower than his averages when his forays from the bench are included.
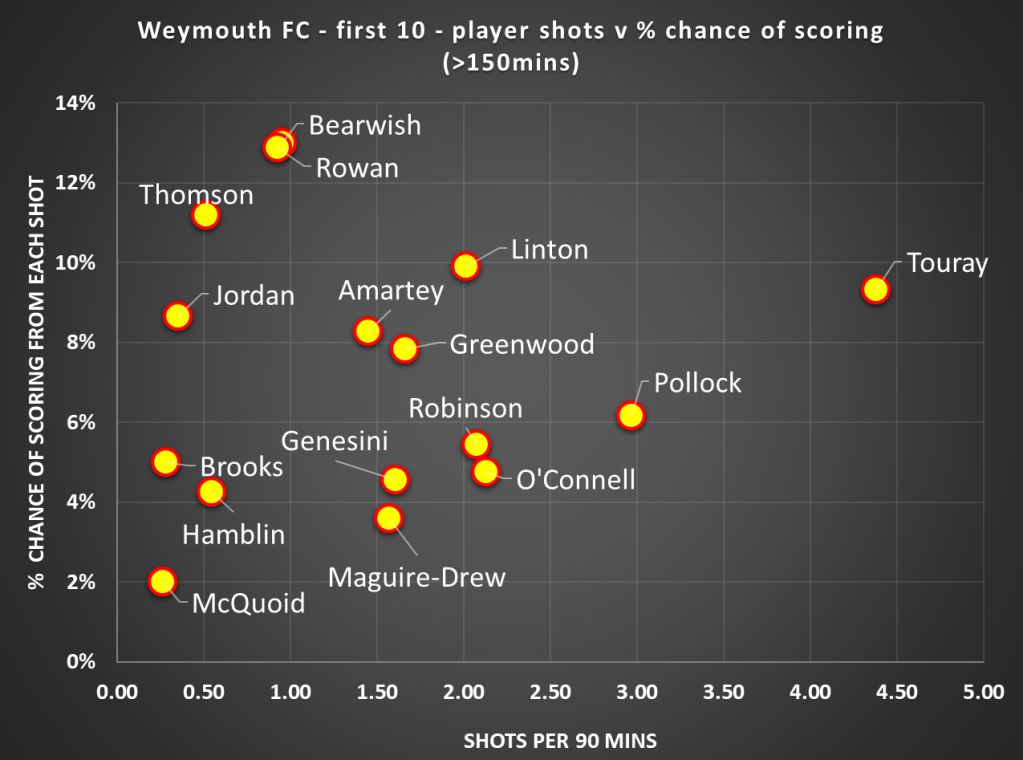
In the top left we see Bearwish & Rowan showing their shooting is apparently the most valuable but they do not fire away very often – can they release the trigger to help us in the goals for column?
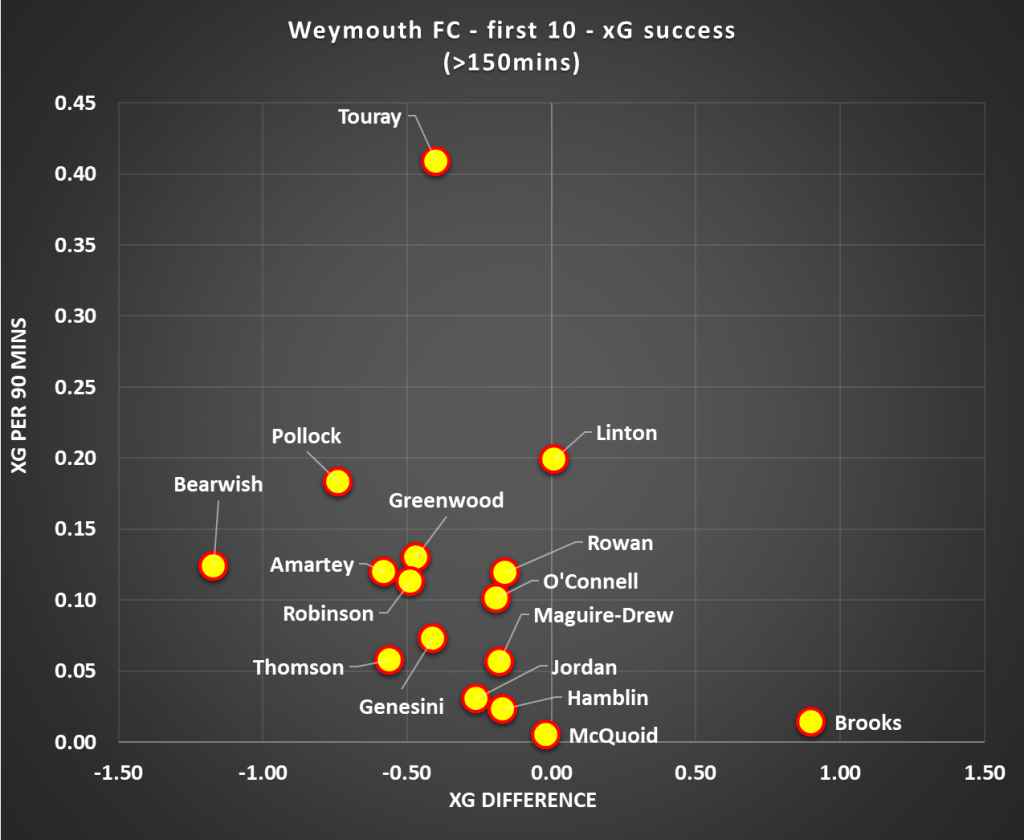
Looking at the xG data another way (chart below) we can see how each player is doing against the expected number of goals.
Right of zero = better than expected, left of zero = worse than expected. Therefore of the 16 players looked at, just 1, Calvin Brooks is doing better than expected. Hardly surprising as he has scored once from just two shots this campaign!
Again Touray is an outlier showing that he has on produced far more valuable chances per 90mins than another player but as the model suggests 1.4 goals his 1 goal marks him down here.
In many ways its perhaps too early to analyse individual players in this way until a few more goals have been scored but we can see something a bit more statistically significant when we add all these up to look at the team as a whole and also factor in goals conceded…
WEYMOUTH FC – FIRST 10 LEAGUE GAMES
Expected goals FOR – 9.9
Actual goals FOR – 5
Difference – Minus 4.9
Ergo based on the chances we have CREATED we “should have scored” c.10 and not 5.
Expected goals AGAINST – 12.4
Actual goals AGAINST – 16
Difference – 3.6
Ergo based on the shots taken AGAINST us we “should have conceded” c.12 and not 16.
If we look at the xG for and against for each match and round it to the nearest number we can calculate the expected points from each game which amounts to 11. That would put us 20th in the table and just out of the relegation zone.
The points that the xG model expected us to get based on chances for and against in each game were –
1 – Tonbridge – 1…we got 0.
3 – Chippenham – 3…we got 0.
5 – Eastbourne – 3…we got 0.
7 – Hampton & R. – 1…we got 0.
8 – Dorking – 1…we got 3!!!
9 – Worthing – 1 (We did get 1 anyway).
10 – Enfield – 1…we got 0.
(In all other games we gained 0 points and that was also the expected outcome)
But how do the other teams stack in the current bottom 7?
Interestingly 4 others (Enfield, Hornchurch, St. Albans & Welling) have all let in more goals than expected, only Aveley & Chippenham are supposedly defending like trojans.
Again, just two teams (St. Albans & Welling) have scored more than the model suggests but by less than 1 goal so not statistically significant).
I have also included the top 5 in the table and you can see they are all attacking & defending better than expected – except Weston who are almost bang-on where the data suggests they should be for goals for and against.
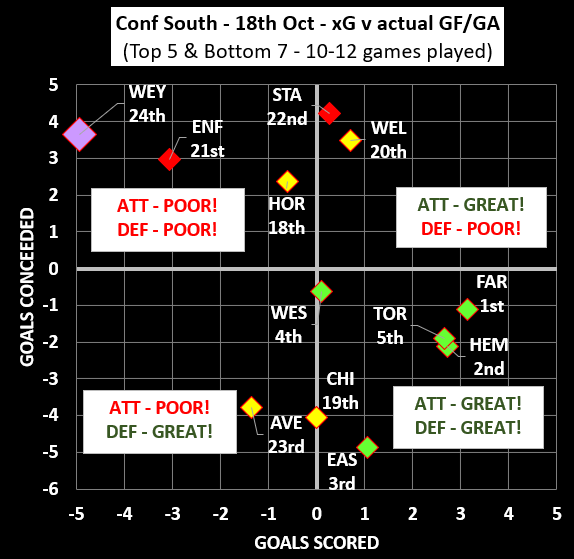
The key question is of course – what does this mean for the Terras?
If they are scoring less than they should be AND letting in more than they should be then does it mean…
A…Our team is worse than average at creating and stopping chances
B…This apparent underachievement will balance out in time
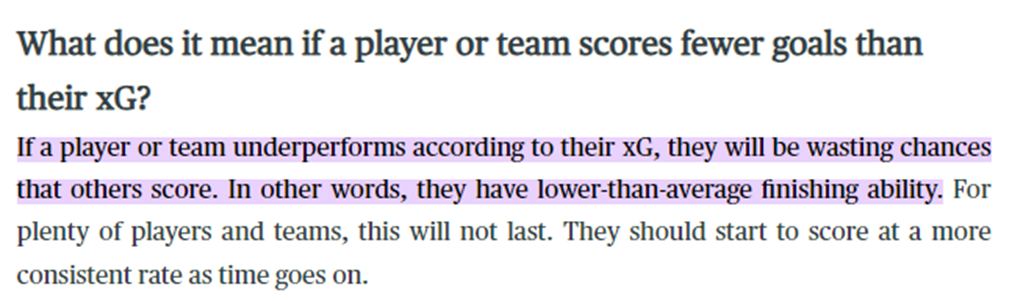
Well…. coachesvoice.com gives us great hope in this regard…
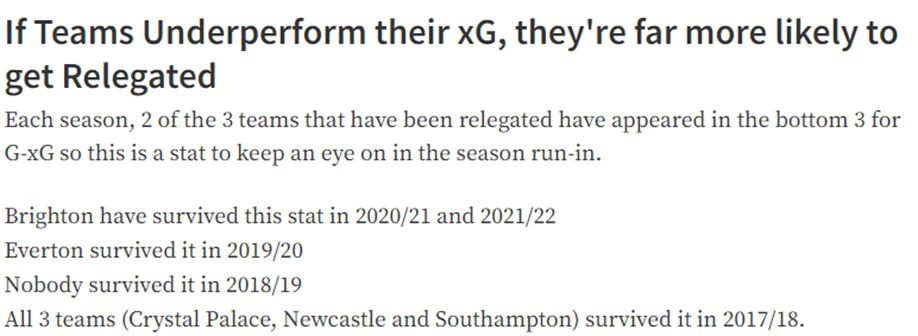
…But then…blurte.intinte.org has an opposing view…
In conclusion…..
Time will tell! I think we need a few more games to determine if we are currently in Lady Luck’s bad books so I will revisit this in a month or so. Obviously as a Weymouth fan myself I am hoping that by continuing to create chances the goals will flow more in the correct net and my gut feels we will – to lose 8 games out of 10 but for 5 of those to be by a single goal is extraordinary and perhaps shows with just a flap of a butterfly’s wings so to speak would have altered the result in at least some of those “nil points” games.
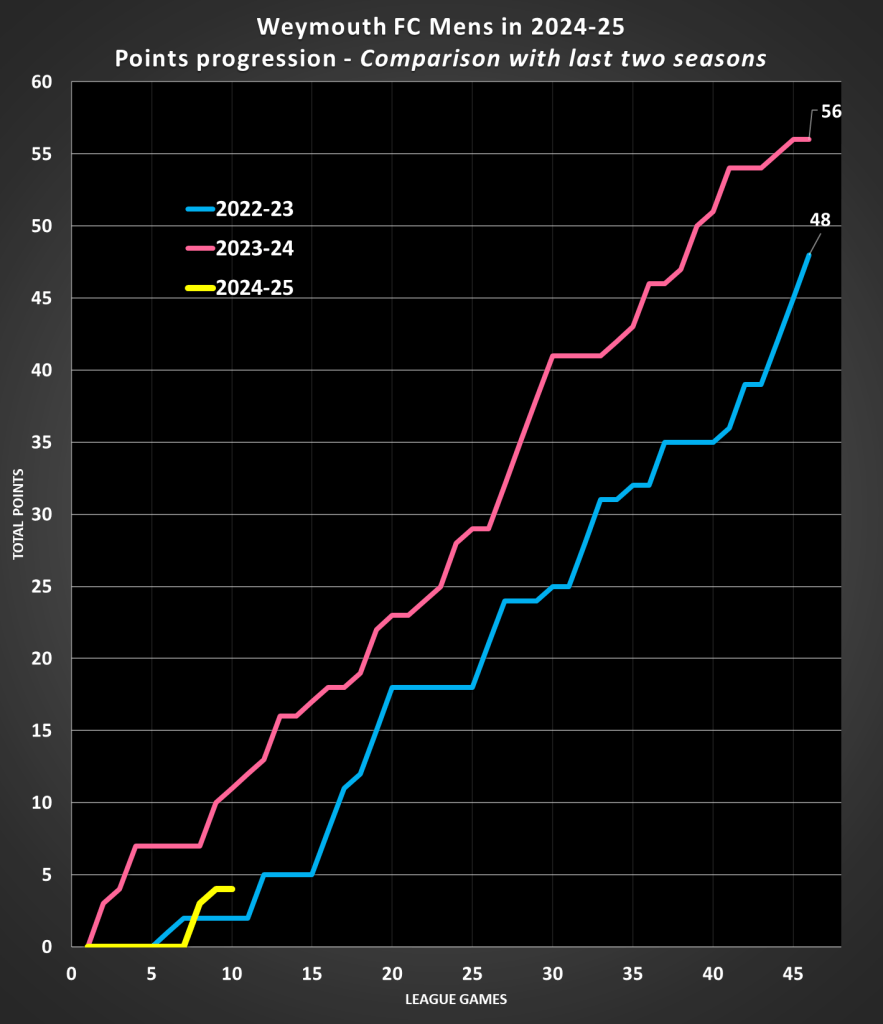
In the mean time lets take a quantum of solace from our great escape season…we have DOUBLE the points we had at this point in 2022/23…

Leave a comment