Comparing the first two sets of 7 league games with Weymouth FC…
The Terras have now played league 14 games this season and the difference is stark between the two sets of 7…
Games 1-7 – 0 points – LLLLLLL
Games 8-14 – 10 points – WDLDDDW
So what has the difference been? Using Sofascore stats we can look for clues…
1. Player scores have improved
Sofascore uses a range of metrics to rate players out of 10. For games 1-7 our average was 6.74 but for games 8-14 it was 6.88 – a slight difference but a definite upward trend culminating in our best score to date in our last game v Aveley – 7.11.
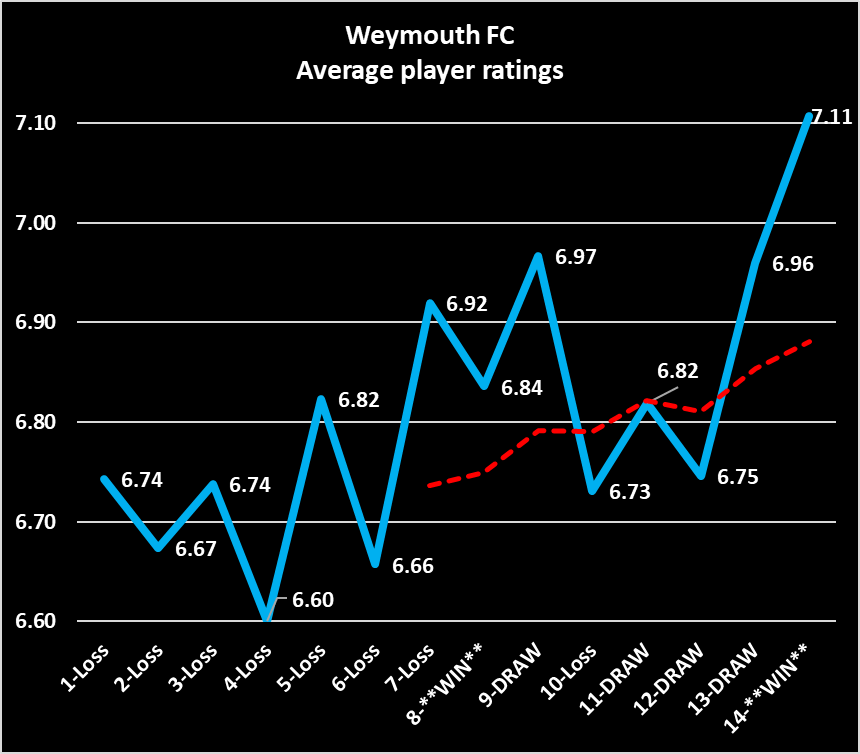
If we look into individual players we can see who has improved the most – comparing the first 7 games with the last 7 –
Goalkeeper – +0.69 Terrell(Games1-7) v Benfield & Buse(Game8 Benfield, 9-14 Buse)
Brooks(DEF) +0.42
Thompson(DEF) +0.39
Pollock(ATT) +0.34
Genesini(DEF) +0.28
Greenwood(MID) +0.24
Robinson(MID) +0.19
O’ Connell(MID) +0.15
Rowan(DEF) +0.11
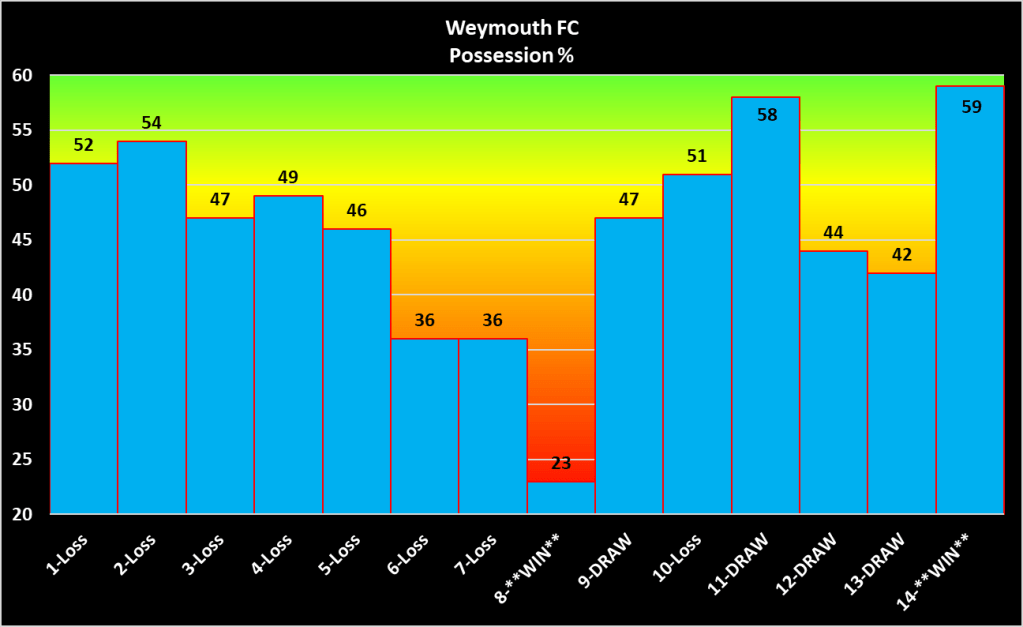
2. Possession
Not the “be all and end all” these days but still an indicator of how well we are controlling each game. Ironically our first win v Dorking in game 8 was when we saw the ball the least so far this campaign but the last 6 games have shown improvement…with our most recent game against Aveley witnessing our highest possession percentage at 59%.
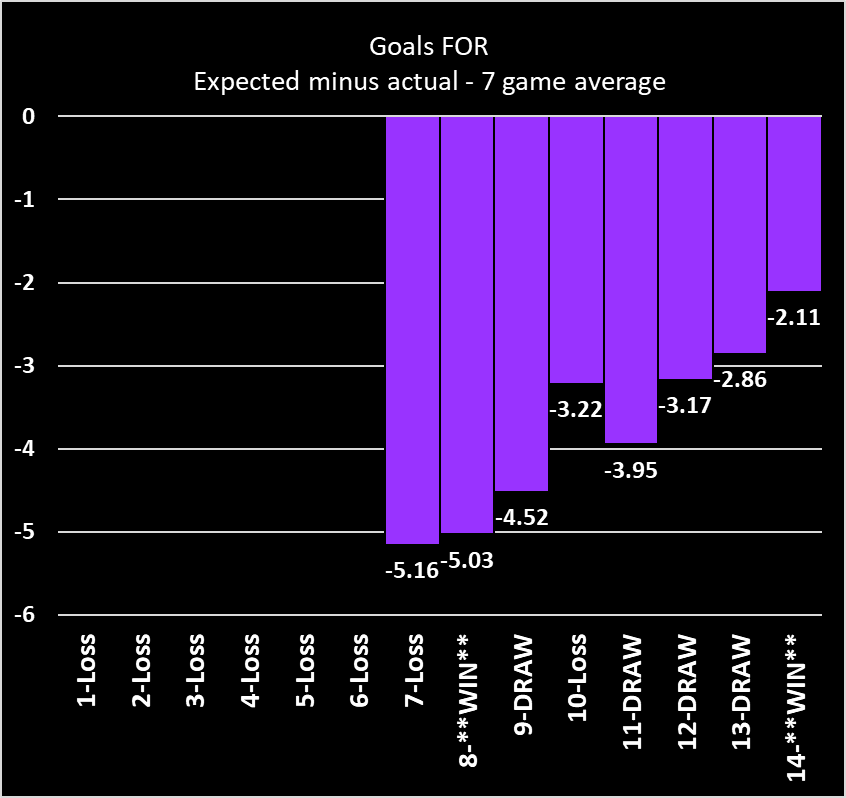
3. Scoring
Still very much room for improvement – just 9 goals from 14 games – the lowest tally in the division – but even here we are seeing an upward trend.
Each bar in the chart below shows expected goals minus actual goals over 7 game periods. Therefore the first bar shows that over games 1-7 we scored 5.16 fewer goals than expected based on our chances but, fast forward to the last bar showing games 8-14…and we see that has increased to -2.11. Overall though xG has expected us to score 16.27 goals at this point rather than 9.
Much of this must be down to the unavailability and/or inability of our forward players to score goals highlighted by our remarkable league goal tally by position outlining that attackers have only scored one third of our league goals to date! –
Attackers – 3…..Non attackers – 6 (Def – 3, Def mid – 2, Mid – 1)
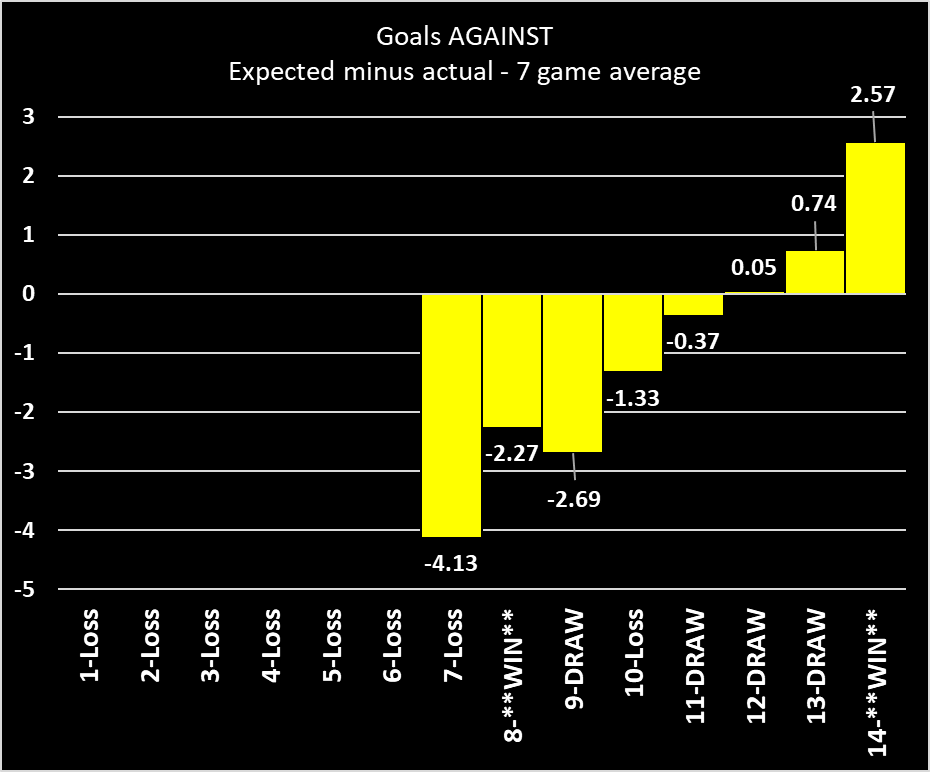
4. Conceding
A much more significant swing can be seen though when we look at goals against. In games 1-7 we had let in a whopping 13 goals – 4.13 more than expected based on the chances against us. Fast forward to games 8-14 and we let in 2.57 FEWER than expected – just 6, less than half of the total in the same number of games.
Looking at all 14 games we are now also almost “in the black” with 19 conceded against an expected figure of 17.44.
ANALYSIS
If we return to the scoring data we can see in another way how we are relying on non-attackers to score our goals and why.
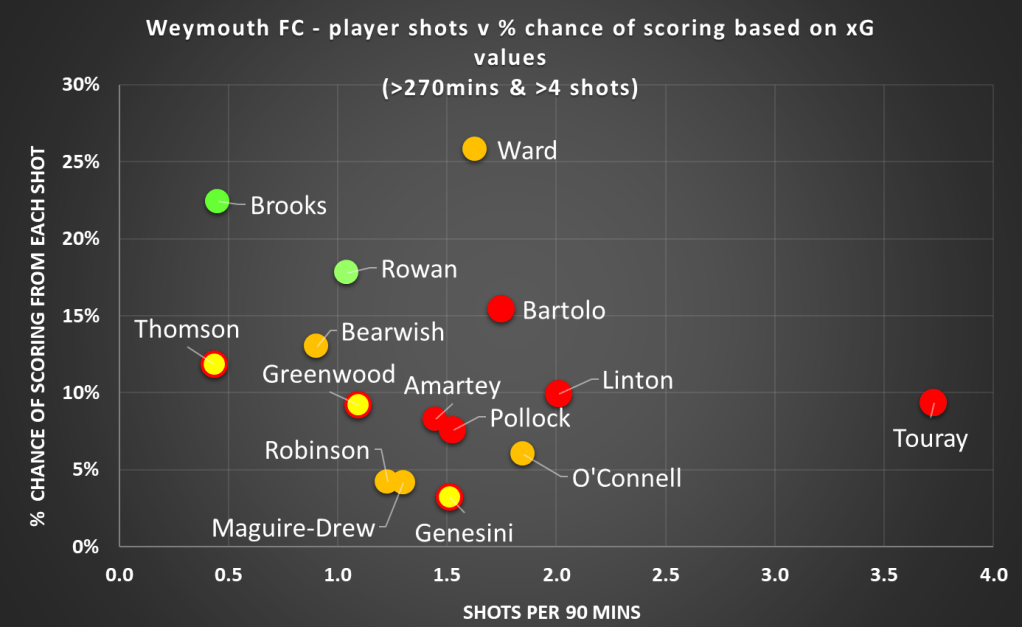
The Y axis shows the average “value” of each shot based on xG and it shows that the three best players in this category or not attackers – Ward, Brooks & Rowan. Unfortunately (and unsurprisingly due to their positions) they do not shoot often so their overall goal threat is low.
On the X axis the top 5 do at least include 5 attackers and 1 attacking midfielder with Touray pinging off the most shots per minute – again unsurprising as we more often than not use him as an impact sub searching for goals.
Crucially though we have no players who shoot often AND with valuable shots – the blank upper-right corner of the graph. Someone will need to move into that space for us to keep climbing the table. (Chart below shows attackers in RED, midfielders in ORANGE and Defenders in GREEN)
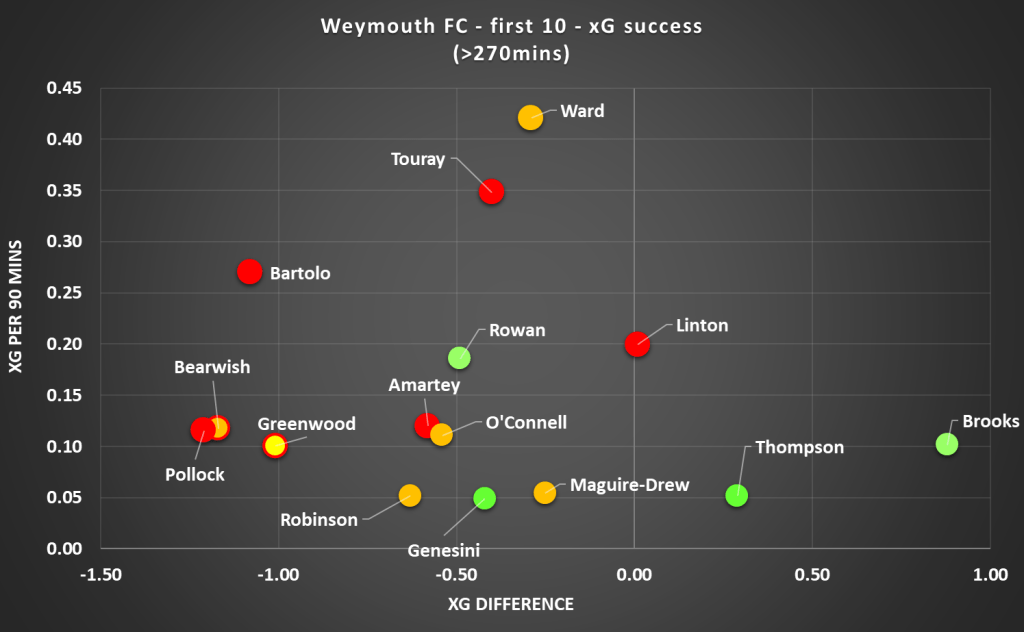
Our general lack of shooting & goal threat can be evidenced another way in the following chart. Here we can see that Bartolo, Touray & Ward are high on the Y axis – they are providing a good chance of scoring in games – however as they are left of zero on the X axis we can deduce they should be doing better with the chances they have had based on xG – they should have scored more often.
Conversely we can see only Thompson and Brooks are over-performing, Brooks to a high degree. (In fact Brooks has scored twice from only 5 recorded shots and as a defender we don’t want to rely on him keeping up that ratio!)
Are we heading for a “Great Escape 2.0???”
The win on Saturday meant we climbed off the bottom for the first time in two months but it is really the last 7 games that have achieved that feat with 10 points gained.
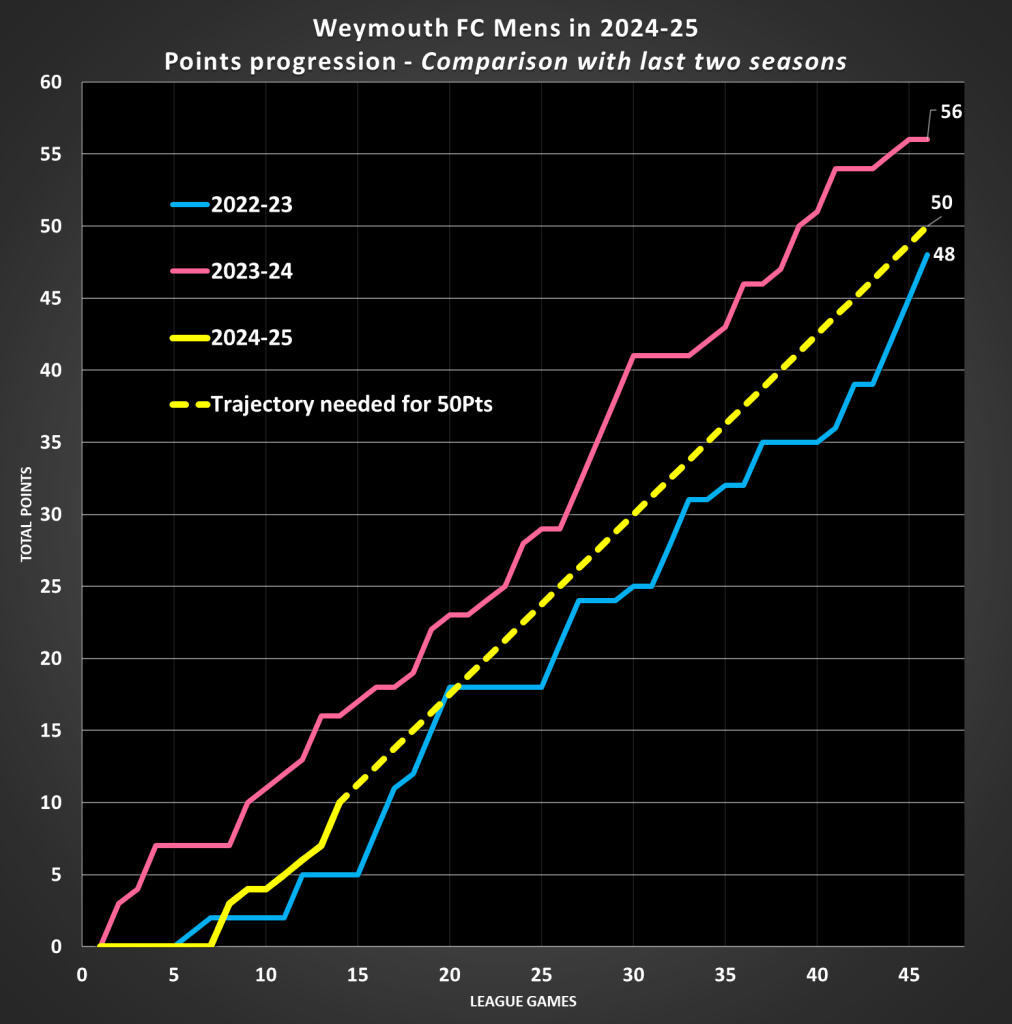
Will that sort of form be enough to save us from relegation this time around? 10pts from 7 is an average of 1.43 points per game – extrapolated over our final 32 games that is 45.7pts. Adding that to the 10 we already have then a final tally of 55-56 would almost certainly be enough.
In fact 50pts is probably a logical safety mark so if that is the case we would neatly require 40 from our last 32 which divides very neatly into trackable chunks –
20 from 16 games
10 from 8 games
5 from 4 games
Maintain that form and we will be around in the conference south again next season…lets review in 8 games time maybe!….

Leave a comment